Graphs - RO-BO Mechanical Workshop
Main menu
- Home Page
- Company
- Contacts Mail
- Coffee Grinder RW-70
-
Valves EN 15089
- Rotary valves EN 15089
- Main features
- Products
- Explosion barrier
- Images
- Certifications
- Valves TN/TS
- Valves TNA/TNAS
- Valves VP/VPC
- Atex valves
- Rotary valves
- Blow Through valves
- Food Indusry
- Diverting valves
- Rotary valves for microdispensing
- Interception valves
- Gearbox
- Spare parts - Works for third parties
- Collaborations
-
Restricted area
- Registration form
- Customers
- Service
Graphs
Blow Through valves
GRAPHICS
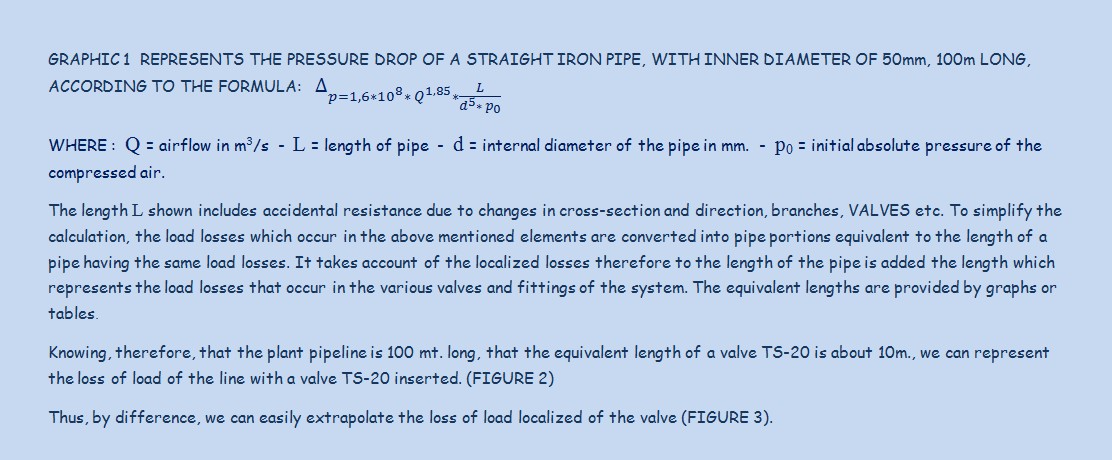
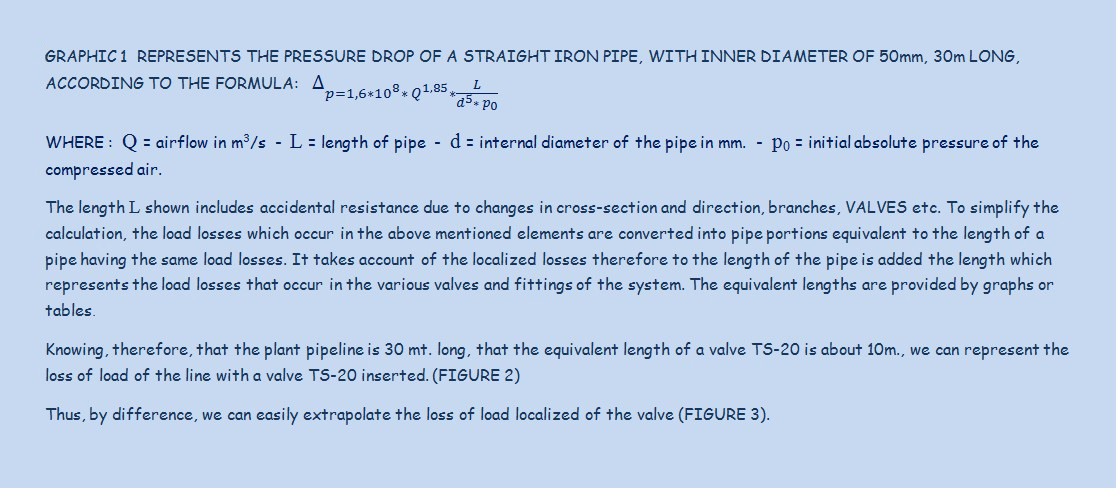
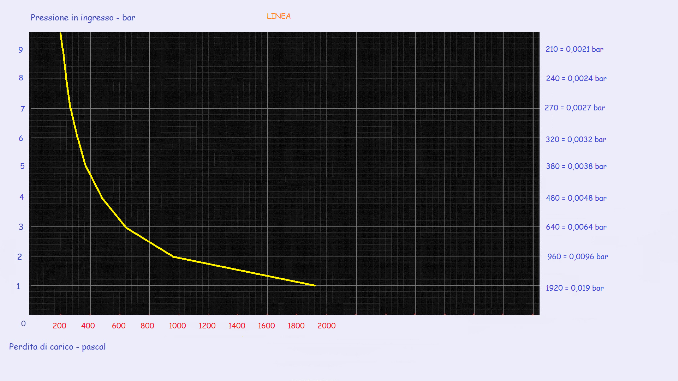
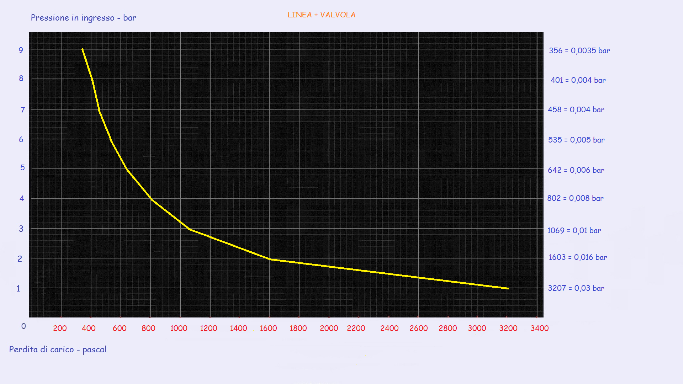
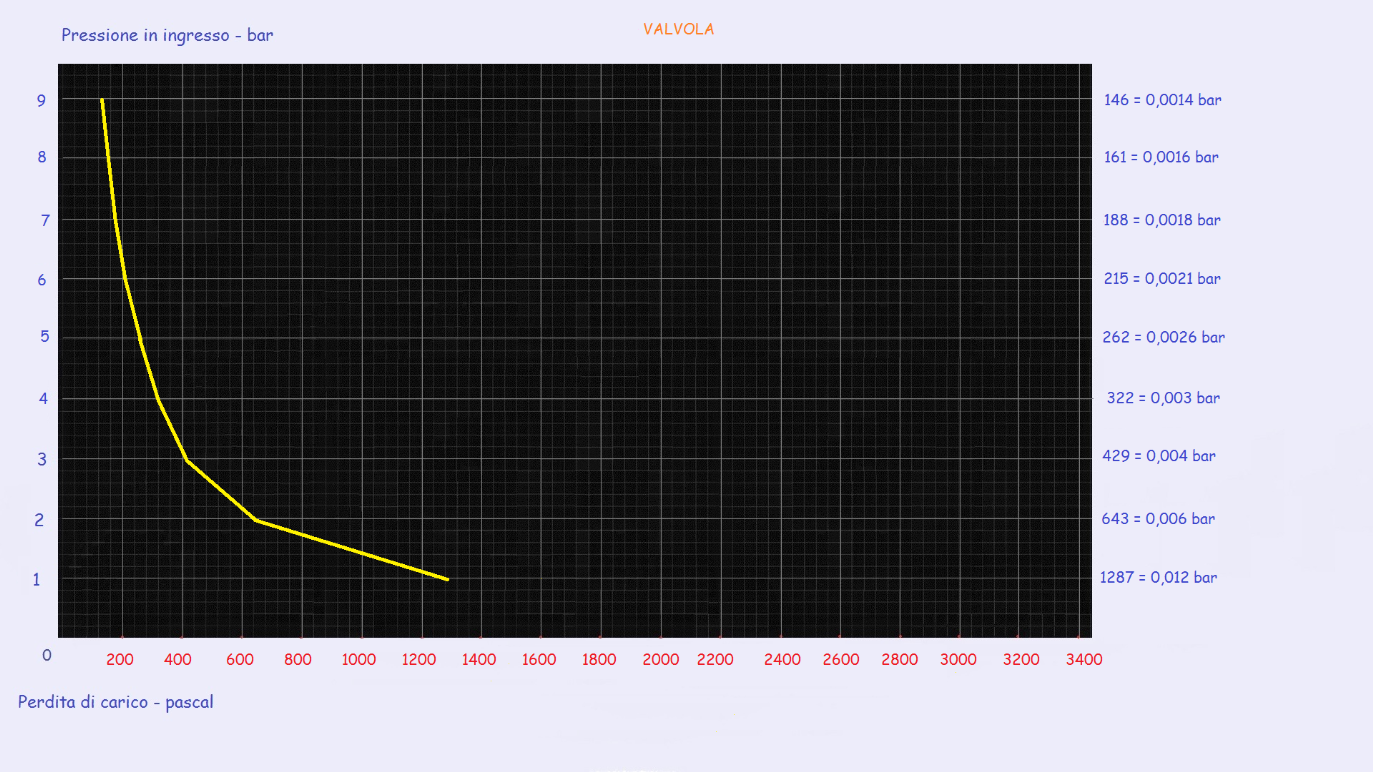
Under the assumptions previously reported, the load losses of our valves are represented graphically as follows:


Home Page | Company | Contacts Mail | Coffee Grinder RW-70 | Valves EN 15089 | Atex valves | Rotary valves | Blow Through valves | Food Indusry | Diverting valves | Rotary valves for microdispensing | Interception valves | Gearbox | Spare parts - Works for third parties | Collaborations | Restricted area | Service | General Site Map

